In Part 1 of this series, we did a brief overview of the EASY installation process for Solarwinds Engineer’s Toolset v10.
In Part 2 of this series, we discussed price, features and the “Freeware” functionality of the Toolset for those of you that having tight budget but still need subsets of the full Toolset.
Today in Part 3, we’re gonna dive into the Workspace Studio and build some environments for the typical Network Engineer.
The Workspace Studio
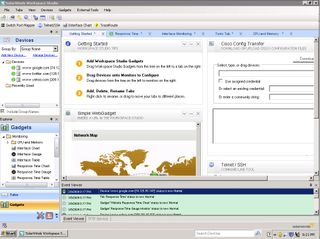
Open the Workspace Studio – the NEW integrated feature of the Engineer’s Toolset v10. It will take just a moment to load all the necessary parts of the Studio. When it’s ready, it will look like this:
Across the left, you’ll see dockable/undockable bars containing all the Devices you wish to know more about (preloaded with a few websites) and all the available Gadgets (like Response Time Graph and WebGadget).
On the middle-top-right you’ll notice all the pre-loaded Tabs – you’re looking at the “Getting Started” tab. There are examples given for “Response Time”, “Interface Monitoring” and more.
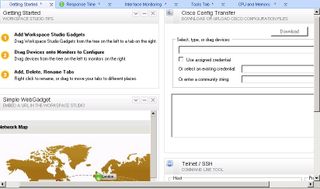
On the middle-right you’ll see the actual contents of the Tabs – again, you’re looking at the “Getting Started” tab which contains a Cisco Config Transfer gadget, a WebGadget, and a Telnet/SSH Command Line Tool.
Across the bottom-right you’ve got a context-aware, real-time, Event Viewer that tells you what is happening in your Workspace Studio.
The Internet Is Slow
How many of you engineers get that complaint? Random person ABC calls and tells you that the Internet is slow – as if it’s YOUR fault that hundreds of millions of computers with hundreds of millions of network paths all across the world, and space, is taking a few extra seconds to load a website. I know I typically like to “slow down” the Internet just to make people call and ask for help, don’t you? You don’t? Oh. Nevermind.
How do you troubleshoot “slow” Internet? If you’re like me, you start with simple “pings” – can you open a command prompt and ping the website and get a reply? Is the ping time “reasonable?” If no to either of those questions, you probably continue with a “traceroute” – is the network route/path to that website complete or does it hang/drop at a certain location? What about other web pages? Do they load? Can you get to google.com, or yahoo.com, or cnn.com, or (insert favorite mostly always available website here)? What about your switches? Routers? Firewalls? ISP Gateways? What’s the % of their CPU? Bandwidth? Wow, that’s a lot of “what” questions. That’s a lot of windows open on your screen too – not to mention all the stuff you were doing BEFORE you got the “Internet is Slow” complaint. Is there a better way? Of course there is, or I wouldn’t be writing this, and you wouldn’t be reading this.
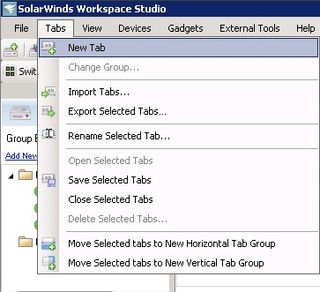
So, open the Workspace Studio. We’re going to create a new tab. Simply choose “Tabs – > New Tab”
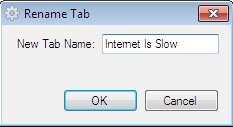
A New Tab is created, called New Tab, which you can right-click on and Rename to something like – oh – "Internet Is Slow" which is more useful.
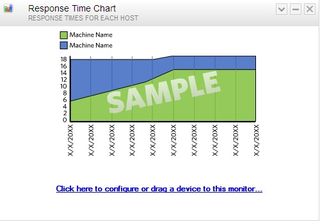
So, the first thing you want is probably ping, right? So, drag the gadget called “Response Time Chart” onto your new tab.
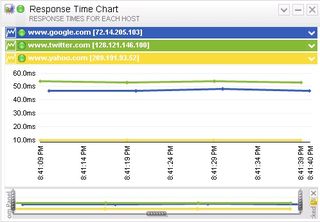
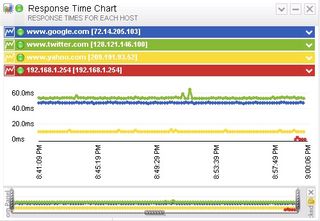
These gadgets are context-aware and can monitor multiple devices and give each a different color. So, let’s start simple and drag the preconfigured devices for google, twitter, and yahoo onto the chart. It’s a simple drag-n-drop from the Devices Dock to the Response Time Chart Gadget. You’ll see that the ping times are charted, and updated, in real-time:
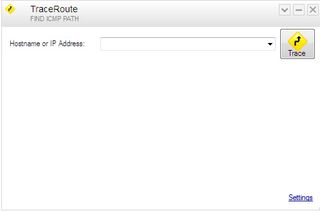
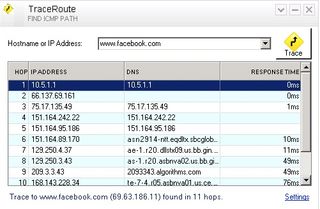
Great, now you’ll want a traceroute to the “slow” website – for instance – Facebook. Drag the TraceRoute Gadget to the Tab.
Type in the hostname that is "slow", like www.facebook.com, and click the Trace button:
Okay, what else is relevant. Well, it would be nice if we could see information about our core routing switch. Let's add that.
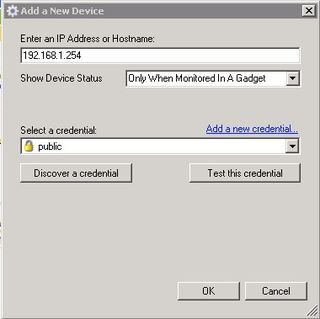
Click on "Add Device" on the far-left hand dock.
Enter the IP or hostname and appropriate SNMP-type credentials and click OK. Great, now, drag-n-drop that to the Response Time Chart so you can begin charting ping-times to that device (in red below).
Fine, but I need more. I want to know the CPU % in use on that device. Let's drag-n-drop the CPU Gauge onto our tab.
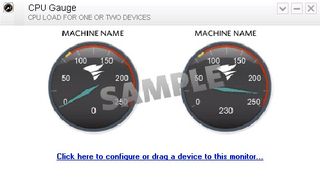
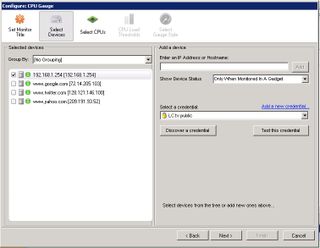
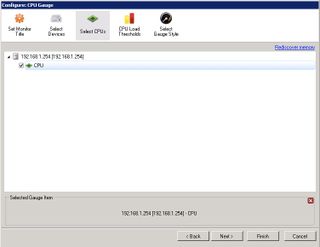
Now, let's drag-n-drop the core routing switch device onto that Gauge. Choose the right device and the right CPU.
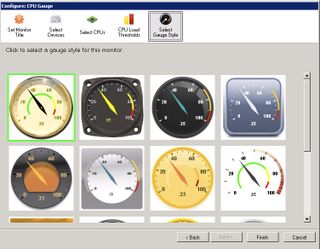
Now you're going to want to choose your Gauge Style and click Finish
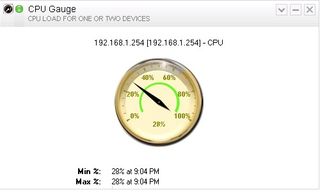
Now, what does that look like?
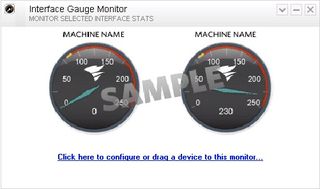
Okay, we're running at 28% CPU on our core routing switch. What else is helpful? How about, information about our Firewall – after all, that's the entrance onto the Internet. That would be nice to know about. Add the Device just like before. This time, let's add the Interface Gauge Monitor gadget to the Tab.
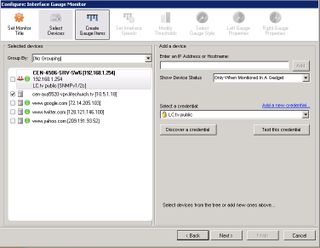
Now, just like you already know how, drag-n-drop the Firewall to the new Gadget
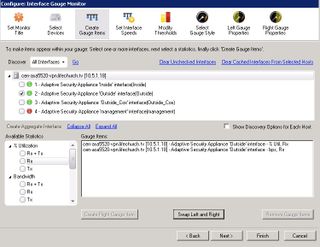
Now you want to see things on the Gauge, so, Create Gauge Items. In our case, we discovered the interfaces and want to see % Utilization, and Bandwidth of the "Outside" Interface. Since we're troubleshooting "slow" Internet, we care about information received (RX).
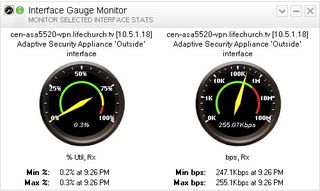
You can get REALLY creative by changing styles and properties of the Gauges. We set what we wanted, clicked Finish, and now it is giving us useful information like this:
Hmm, that's helpful. We have a 30 Meg internet connection. We're only using 250k of that. The interface utilization % is low. And the internet is slow.
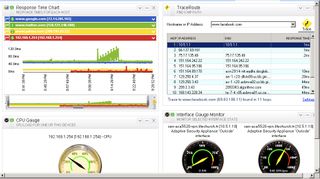
All together, this Tab looks like this.
At a glance, we can see the ping times that have been charted. We can see the traceroute. We can see the CPU % of our core router. We can then see the RX view of our Firewall.
That helps us know that it's not on OUR network. Right? Things look good, so now the Network Engineer can pass off in one of two ways – it's Facebook's problem (they are slow) or perhaps, it's isolated to one machine – and then troubleshooting of plugins, other applications, Ram issues, or maybe a simple reboot will help.
This is an overly simplistic, but yet VERY USEFUL tool. Now, whenever you get the "Internet is slow" phone call, or email, you can launch Toolset v10, open the "Internet Is Slow" tab, and instantly begin diagnosis from one location.
What if you need more? Well, add more gauges. Add more Interfaces. Add more charts. You can do that!
A Few More Simple Tabs
This blog post is long enough already, but these are the Tabs that are next on my list for daily (or weekly) use at LifeChurch.tv. As they are built, and put into production, I'll give more detail at that time.
- Email is slow
- Picture a tab with useful information gleaned from Exchange 2007 using the gadgets that are here, or gadgets that are sure to come in the future.
- Multi-site / Campus view
- Picture a tab that has a Ping chart for the primary interface at each remote campus (14 remote campuses for LifeChurch.tv at the time of this writing)
- Add multiple Gauge gadgets in order to view CPU %, or Bandwidth, or whatever for each remote router
- Backup all Cisco Configs
- Picture a tab that has the Cisco Config Transfer Gadget – source, destination, transfer. Go
A Slightly More Advanced Tab
LifeChurch.tv has a GOC – Global Operations Center – at our Central Offices in Edmond, Oklahoma. From the GOC, several staffers each weekend "monitor" all the campuses. There is a visual matrix where they can pull up "big brother style" the stage and see how the Worship Experience is going.
Wouldn't it be great to have a side-screen that also shows certain Network details? Take the Multi-site / Campus View tab above. Add to it a Web Gadget that has a real-time updated weather map. You can then have a view into how weather might be affecting network traffic. Add another Web Gadget to Church Metrics so we can monitor attendance at all the campuses. Again, we can see how weather might affect attendance at all our campuses too.
Another Slightly More Advanced Tab
What if you could take the GOC tab above, and display a subset of information in your IT Offices? Do you think if your user community to have an "at a glance" view of Email, website, web services, (insert favorite application here) that it might lead to less phone calls? Google did this recently with their App Status Dashboard. Would your user community, or executives, like this? A nice 24" LCD display is just a couple hundred dollars now. Remember too, you can utilize Toolset v10 in Freeware Mode. I bet you would like that.
Now, what about you? What are some tabs you'd like to see/use? I've only begun to scratch the surface of what the Toolset v10 Workspace Studio could offer. As I get more into it, and learn more, and take some more tabs into production, I'll be sure to come back and share in future blog postings. For those of you that read this and utilize Toolset v10, please, come back and share anything you blog about.



This is really good info. Do you think this dashboard view could replace SolarWinds Orion? Do they still have a 2MB limit to capture data?
Thanks,
GB
@gbonamission
Very nice information. Thanks ….
Hi All,
Engineer’s Toolset 10 does have a 2GB data storage limit as documented here http://www.solarwinds.com/support/Toolsets/docs/ReleaseNotes/releaseNotes.htm
Toolset won’t replace NPM but it does add many real-time trouble shooting tools and integrates with Orion using a right click.
Andy McBride
Daryl,
You should share the creative solution that we’ve developed here at LC to document when the internet is slow. Maybe in true LC fashion we could open-source it and make it available to other organizations.
Zach