Hi my friends! It’s almost the end of the month, and the end of another busy quarter! What have you been up to? It’s been a whirlwind here!
Lately, I’ve been spending more time experimenting with Agent Builder and Microsoft Copilot as part of my day-to-day work. Not as a thought exercise, and not as a demo—but as a way to answer real operational questions that normally require stitching together data, spreadsheets, and follow‑up emails.
One of my recent posts has been related to how I use Copilot Analyst. In that post, I described a regular things my team does. We have an internal process called UAT (Unified Action Tracker) that captures customer requests and feedback into Azure DevOps. The information I want to capture includes the usual customer/sales type of information – customer name, opportunity (revenue or consumption), area, region, products affected, and then some free-form information describing what help is needed, or what the feedback is, how to reproduce the “thing” and maybe some attachments and screen shots.
Conceptually, I do that “thing” a lot – but now – I’m turning to Agents rather than interactive prompting.
The Question
Very recently, my manager asked one of those fun operational questions. It went like this:
- “Who has opened UATs in the last week – and what are their Titles? Can I see that Globally and then by Region?”
It sounds like a straightforward ask. But in practice, answering it consistently meant pulling records, filtering by date, normalizing names, inferring roles, grouping by geography, and then explaining the results to leadership in a way that actually made sense.
So I went about answering the question. But, I also knew this ask was part of a repeated reporting function my manager was working on. So, instead of solving it now, and then again over and over, I decided to build something once.
The Key
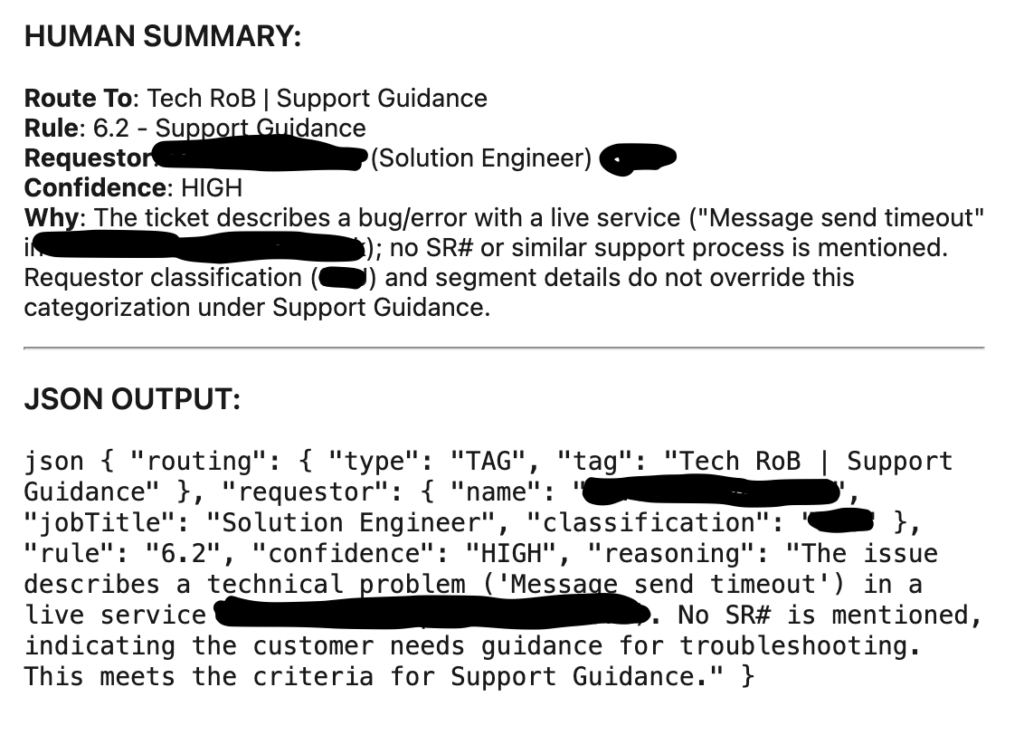
UAT activity is a signal to us. It tells us where customers are testing, which teams are engaging, and where feedback and asks for engagement are starting to concentrate. But, that signal is easy to miss when the data lives in logs and tables and – in this case – Azure DevOps – instead of narratives. Our global tools team already surfaces “breadcrumbs” of this data in ADO in a field we called TechROBSummary and the output of that might look like this:
So similar to what I blogged about with Copilot Analyst, I have ADO query and I want to include the TechROBSummary column and export all of that data to CSV so I can do something useful with it.
What I wanted was relatively simple:
- A repeatable way to answer the same question every week (or every time it was asked)
- Output that felt ready for an executive summary, not raw data (like the JSON or even “human readable” summary from above)
- Minimal effort once the data existed – start with a CSV export and then “do the work”
In other words, I didn’t need a chatbot. I need an opinionated agent that knew exactly what question it was designed to answer – and how to answer it well.
Why I Chose Agent Builder
This is where Agent Builder really stood out for me.
The question I was asked, and the task I was trying to solve, wasn’t about performing an action or orchestrating a workflow. It was about interpreting existing enterprise data and expressing it clearly. Agent Builder is well-suited for this kind of knowledge-first, permission-aware analysis inside Enterprise contexts. Rather than over-engineering a solution (my favorite!) I learned what Agent Buillder does best:
- Strong grounding in enterprise data
- Natural-language instructions instead of code
- Strict scoping when the instructions are written carefully
That last part turned out to be crucial as you can read below.
Designing the Agent’s Instructions
The biggest lesson I learned – quickly – is that agent quality live and dies by its instructions. I started with Agent Builder Instructions similarly to how I use Copilot Chat – I just started writing what I wanted. Here are a few basic excerpts I used to get started:
#task Task: Parse the and extract all requestor job titles from the TechROBSummary colum
#Guidelines- Strip HTML before parsing- Extract titles using all patterns: Job Title:, jobtitle:, job_title:, JSON keys (jobTitle, job_title), and inline formats Requestor: Name (Title), Requestor: Name - Title, Requestor: Name, Title. - Use columns Area and TechROBSummary for your analysis and alignment
#definitions - three worldwide Regions - Americas, EMEA, Asia - Using column titled Area, identify which Areas are on which Region - Region Americas: United States, Latam, Canada - Region EMEA: North Europe, South Europe, France, Germany & Austria, MEA, Netherlands, Switzerland,and UK & Ireland - Region Asia: ANZ, ASEAN, Greater China, India, Japan, Korea - three account units - the ATU, STU, and CSU
#titles - Typical titles for ATU are Account Executive, and Account Technical Strategist. The cases might be mixed. The words could be shortened. There could be senior or director or principal of each of these or even managers signified by MGR or MGMT. Group all of titles in the ATU together.
- Typical titles for STU are Specialist, or Technical Specialist (ST), or Global Black Belt (GBB), or Sales / Solution Engineer (SE). The cases might be mixed. The words could be shortened. There could be senior or director or principal of each of these or even managers signified by MGR or MGMT. One edge case variation of Solution Engineer is Principal Sol Engineer.
- Typical titles for CSU are Cloud Solution Architect (CSA) or Customer Success Account Managers (CSAM). The cases might be mixed. The words could be shortened. There could be senior or director or principal of each of these or even managers signified by MGR or MGMT or something similar. Edge case variations of CSAM include Principal Customer Succ Account Manager and Principal Customer Succ Account Mgr and Principal CUSTOMER SUCC Account Manager. Those include shortened words Mgr (for Manager) and Succ (for Success).
But this quickly became a problem! Our data for titles is varied and as you can see above, I was trying to account for things like upper and lower case. I was trying to account for abbreviations like MGR or MGMT or ACCT. This became nearly impossible to find all of the variations. Additionally, when I began iterating on my instructions, Copilot started becoming *conversational* and *helpful* which isn’t really what I wanted. It started to summarize and “collapse” too early. It was not reading the entire file and analyzing each and every row. I was giving too much leeway in my instructions. I had to do better.
First, I modified the Guidelines to force a deterministic, full-file parse. This did not allow any sort of shortcuts or file summarizations or retrievals. It consistently got ALL output – every row, every job title variant, every time.
Next, I needed to normalize the titles. I tried in that “prose / paragraph” form above, but, there are an infinite number of possibilities. So I needed to rewrite my instructions to be more specific and more consistent.
Next, I realized order matters. If we group into the ATU/STU/CSU too early, we lose visibility into what was actually present. I had to adjust the order: Read -> Titles -> Normalize -> Mapping -> Final output
All of this analysis was great, but, I needed to define the output. At first, we thought about charts with specific callouts of ATU, STU and then the CSAM/CSA title. Then we wanted CSU all up and then a break-out of CSAM/CSA. We started with counts, and then settled on %s.
Here are a few excepts of how we solved some of that:## HARD REQUIREMENTS
- Use **Python only** (direct CSV parsing)
- **No summarize_file / retrieval**
- Scan **100% of rows**
- Parse **full TechROBSummary text**
- **Strip HTML** before parsing
- Use **Area + TechROBSummary** columns
Those first three lines were key to consistency!!!
Then titles:## GLOBAL NORMALIZATION (APPLY FIRST)
- Case‑insensitive
- Normalize whitespace, hyphens, slashes, commas
- Expand abbreviations before classification:
Acct → Account
Acc → Account
Strat → Strategic
Succ → Success
Mgr → Manager
Mgmt → Management
Sol → Solution
Tech → Technical
Eng → Engineer
Sr → Senior
Prin / PRIN → Principal
CSA → Cloud Solution Architect
- Ignore seniority and management terms for grouping
## ROLE GROUP DEFINITIONS (AUTHORITATIVE)

### CSAM — CUSTOMER SUCCESS ACCOUNT MANAGER (**HIGHEST PRECEDENCE**)
Must contain **ALL four concepts** (any order, any form):
- Customer
- Success
- Account
- Manager
Abbreviations allowed
If all four are present -> **ALWAYS classify as CSAM**
then I did similar things for CSA, ATU, STU, etc. – and I accounted for “others”
Finally I identified the output, here’s an example of the “Global” chart:
## OUTPUT (IN THIS ORDER)### 1. Account Team % Breakdown
Produce **one table** with the following structure:
- Titled: "Weekly UAT % Breakdown by Account Team"
- **Rows (fixed order):**
  - ATU
  - STU
  - CSU
  - Others - but be sure to label this column as "Non-MCAPS" and not the word "Others"
- **Columns:**
  - **Global %** (percentage of total global requestors)
- **Rules:**
  - Percentages only (e.g., `23.2%`)
  - Do **NOT** include counts
  - Do **NOT** include totals or sample sizes
  - Round to one decimal place
- **CSU Row Rules (Global Table)**
- CSU row must combine CSAM and CSA
- Format the Global % cell excactly as:
- Total: XX.X%, CSAM: YY.Y%, CSA: ZZ.Z%
- Where:
- Total = (CSAM + CSA) as a percentage of all global requestors
- CSAM = CSAM percentage of all global requestors
- CSA = CSA percentage of all global requestors
- Compute Total from raw counts, not by summing rounded values
That’s a lot of information. But, in summary, instead of letting the model decide how to respond, I constrained it to one clear analytical task: Identify the people who opened UATs, Associate them with a Title, Group those results by region, And then present findings cleanly.
This approach aligns with how Microsoft recommends building enterprise-ready agents – narrow scope, clear intent, and governance baked into designed decisions!
And the final output looks something like this:
Weekly UAT % Breakdown by Account Team
| Row | Global % |
|---|---|
| ATU | 2.0% |
| STU | 43.2% |
| CSU | Total: 48.0%, CSAM: 20.3%, CSA: 27.7% |
| Non-MCAPS | 6.8% |
Regional Breakdown
Americas
| Row | Americas % |
|---|---|
| ATU | 1.7% |
| STU | 32.8% |
| CSU | Total: 56.9%, CSAM: 19.0%, CSA: 37.9% |
| Non-MCAPS | 8.6% |
EMEA
| Row | EMEA % |
|---|---|
| ATU | 0.0% |
| STU | 59.6% |
| CSU | Total: 38.3%, CSAM: 21.3%, CSA: 17.0% |
| Non-MCAPS | 2.1% |
Zero entries (EMEA): ATU = 0.0%.
Asia
| Row | Asia % |
|---|---|
| ATU | 5.9% |
| STU | 38.2% |
| CSU | Total: 47.1%, CSAM: 26.5%, CSA: 20.6% |
| Non-MCAPS | 8.8% |
What I Learned Along The Way
Here are a few lessons that stood out:
- Narrow Agents are Better Agents
- Trying to make an agent “smart” is tempting. But the most reliable agents are the ones that ar focused: One question, One job, Done well.
- Instructions Are Product Design
- Agent Builder feels simple on the surface, but writing good isntructions is closer to UX design than prompt engineering. Every word shapes behavior.
- Determinism Beats Creativity at Work
- In an enterprise setting, consistency matters more than cleverness. I’d rather have the same answer every time than a “new perspective.”
- This is a Shift In How We Work
- This wasn’t about automation for speed. It was about changing where understanding lives – from individuals to built systems. Because I want to take vacation sometime 🙂
Wrap Up
Okay, that’s enough wordy words from your pal DW.
I didn’t set out to build an agent. I set out to stop answering the same question manually.
Agent Builder turned out to the be the right tool because it let me encode how I already *thought* and *reasoned* about the data and it make that reusable.
And honestly? This is the REAL PROMISE of agents in the Enterprise.
Thanks for sticking with me. I hope this was helpful for you. As I continue solving problems and learning, I’ll share those with you here! Take them and make them your own. Or, ignore them and move on. Your choice. Until next time…
1 thought on “My Sandbox 365: Copilot Agent Builder – ADO Insights”
Comments are closed.