Do you monitor your network? With what product? What do you monitor? Interfaces? CPU? Memory? Applications? I really really hate it when I get a "the network is slow" or "email is crawling" or similar emails. I don't mind the emails themselves, I'm here to serve, but what I hate is when I don't have an answer and can't help the person asking me or help.
I've tried several products in the past. I've used Solarwinds Toolset. I've used (and still do) Cacti. I've tried OpenNMS (granted, I didn't give it a fair shot). LifeChurch.tv has an SLX license (unlimited node) for Solarwinds Orion NPM (Network Performance Monitor) but we've not utilized it to the fullest capabilities. I'm on a quest to do so. Today I added the Orion APM (Application Performance Monitor) module and hope to gather some rich information about the applications on our network – and not just blinky lights, pings, and interface statistics (even though those are very useful as well).
Let's Install This Badboy
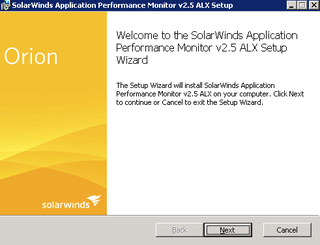
The installation of Orion APM should be painless – it's just a plugin/module for Orion NPM and utilizes the same Web GUI Console for configuration, monitoring. Launch the installation file:
Great. Next.
Accept the EULA. Next.
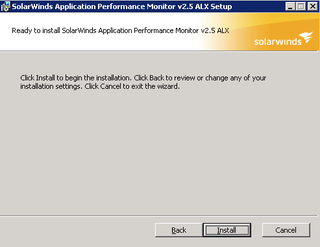
That's simple. Click Install.
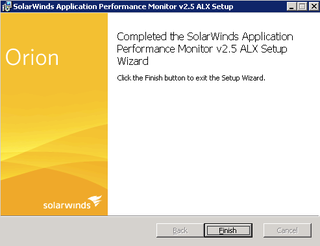
Wow, that was fast. Click Finish. Up pops licensing.
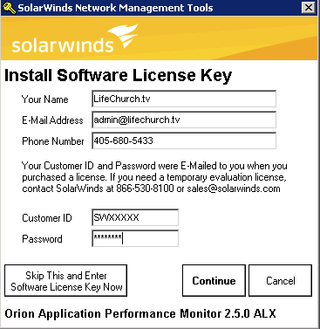
Enter all your licensing information. Click Continue.
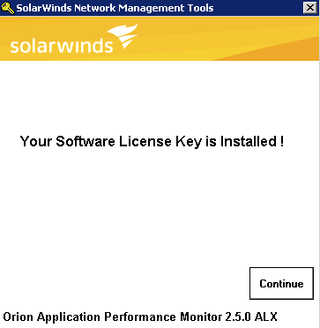
Hooray! License is installed. Basic Configuration auto-launches.
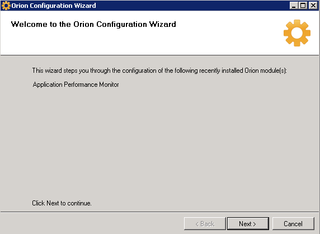
Yup, this is what we want. Click Next.
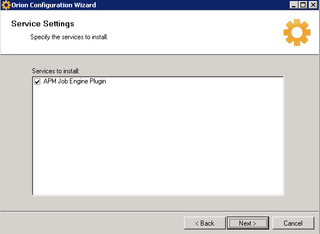
Yes, the APM Plugin. Click Next.
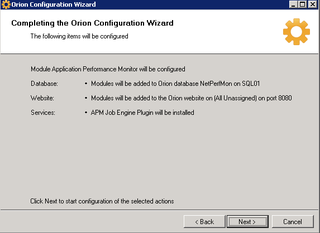
Verify configuration. Click Next.
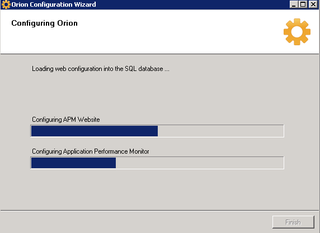
Installation starts. This takes just a few minutes. This will stop services, update your database, update the NPM itself, and restart services.
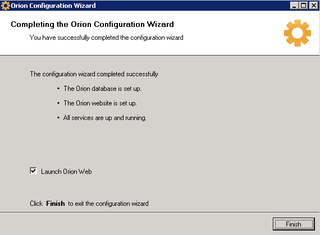
Great. All done. Click Finish. You're done with the install.
Let's Monitor Something
I'm just going to walk through monitoring a single application – Exchange 2007. Start by launching the Web GUI Console for Orion NPM:
Login – yeah – that'd be useful.
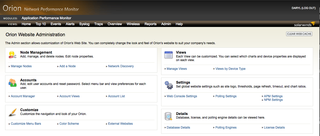
Choose the "Admin" View from the Network Summary Home screen.
Choose "APM Settings" – you'll find that under the "Settings" Group in the Orion Website Administration section.
Click "Start Assigning Application Monitors" – this will get us started.
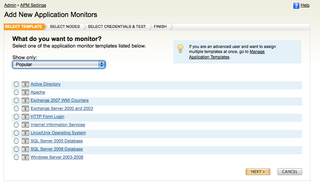
You'll notice the list of "Popular" monitors. For our purposes, click the list, and change to "Exchange" – that's what we want.
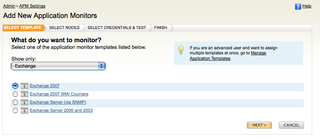
Select "Exchange 2007" and click Next.
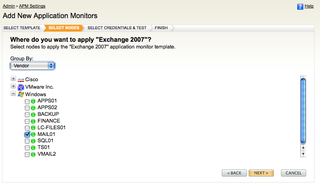
Select the node to apply the "Exchange 2007" template to. We'll choose "Mail01" and click Next.
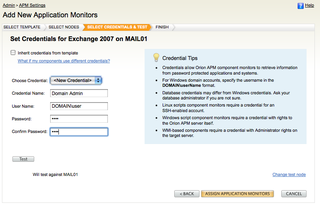
Select the appropriate credentials and click "Assign Application Monitors"
Great. You're done. Note, it may take a few minutes to show good information. Click Done.
Show Me Something Cool
Wait a few minutes and bring up the APM Console.
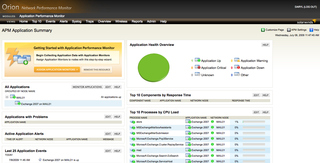
From this dashboard, you can see All Applications, a Health Overview, Some Top 10 lists, etc. I won't get into a ton of details here. I just wanted to show you something cool. You can Edit this page, like any page in Orion, to show you the important things you want in whatever format you want them.
That's all for today. I'm looking forward to diving further into Orion NPM & APM.
I'd love your feedback. As I asked at the beginning of this post, what are you doing for monitoring?


We currently use Whatsup Gold but only for pings. I am currently considering switching to Nagios.
Hey David, thanks for the visit. I’ve done some Nagios work as well in the past. You can get some decent stuff if you find the right template and don’t mind a little “pain” at first getting it working. I think I still have a Cacti/Nagios implementation that an intern helped me with – not really, he did all the work, I just watched – from a previous organization. I remember it being difficult to setup and manage, but I liked the information it pulled.
Have you looked at my Toolset posts? Some of the Toolset functionality is available for free – you should check it out.
I looked at the toolset post and am using some of them. Since you have used both what is the major difference between Nagios and OpenNMS?
David, here’s a really good writeup on Nagios / OpenNMS
http://www.rootdev.com/tech/opennms-vs-nagios
–DW